Stanford’s Mark Jacobson and Mark Delucchi made headlines at the end of November for their pronouncement that 100 percent renewable energy is possible in most countries. The publication came out in time for the COP 21 conference in Paris. The findings do not overlap with what researchers in Germany publish. Craig Morris explains.
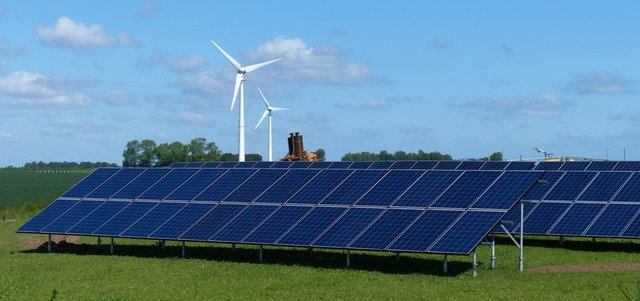
Two Frauenhofer studies produced numbers far from what the Stanford researchers reached. (Photo by Mat Fascione, modified, CC BY-SA 2.0)
Back in 2009, Jacobson and Delucchi began publishing reports on 100 percent renewable energy worldwide (PDF and PDF). In November, the researchers published their latest update (full PDF). A presentation is also available at the 100.org website, which openly states it is a “campaign.”
The main point that Jacobson are making at the COP 21, according to an article in Scientific American, is that “international agreements to reduce carbon dioxide emissions… would not even be needed if countries switched wholesale to renewable energy.” The message is excellent. But what if their specific proposal for 100 percent renewable energy looks much different from others?
Below, we see their breakdown of energy sources for 100 percent renewable energy in Germany.
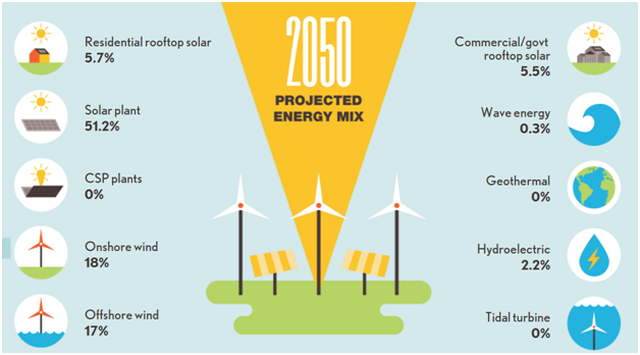
Source: The Solutions Project
The omission of biomass is not an oversight. Rather, the researchers investigate WWS: wind, waves, and solar. Without biomass, Germany would apparently get nearly 2/3 (62.4 percent) of its energy from solar. In comparison, the Fraunhofer IWES study from 2014 on 100 percent renewable electricity only had around 20 percent solar power, with a third coming from onshore wind and a fifth from offshore. These numbers are hard to reconcile and probably reflect the US researchers’ personal predilection for solar.
Fraunhofer ISE’s also recently looked into 85 percent renewable energy. It produced numbers far from what the Stanford researchers reached: nearly half onshore wind, around a sixth offshore, and roughly a third solar. The two Fraunhofer institutes thus have fairly similar scenarios, neither of which is anywhere close to the Stanford findings. Note that both German studies contain a small share of biomass, which makes up a tenth of power supply in the IWES study. Because bioenergy is used more outside the power sector (as fuel for transportation and heat), it is slightly higher in the ISE study at around a quarter of total energy. A certain amount of sustainable biomass simply is available, especially from waste.
In terms of cost, the Stanford researchers put the annual energy, healthcare, and climate cost savings in Germany per person at a whopping $11,141. And again, these figures are not in line with the ISE estimate (the IWES study did not investigate cost), which comes out to be around 7,800 euros per capita in 2050 – for “only” 85 percent renewable energy. However, ISE found that installed capacity would roughly double from 80 to 95 percent renewables. The cost of 100 percent was not investigated, but one can assume it would be roughly twice as expensive as 85 percent, probably producing higher costs, not lower.
The weak points in the 100 percent campaign are aviation, shipping, and steel production. Back in 2010, Jacobson and Delucchi assumed that ships and planes would run on hydrogen. The new paper still says the same: “hydrogen… will be used primarily for long-distance trucking, heavy ships, and aircraft, can be produced by WWS electricity during any time of a year.” This option is possible but also costly and relatively inefficient; there is, however, no other clear alternative. Neither paper investigates steel production with renewables, though the former explicitly states that the use of “steel will likely increase.” Carbon from biomass is the only realistic replacement for coke, but the US researchers seem to oppose bioenergy: “No natural gas, biofuels, nuclear power, or stationary batteries are needed.” Furthermore, a main finding in the IWES study was that stationary batteries will be used to stabilize the grid.
It is a bit disconcerting that the Stanford researchers (or should I say “campaigners”?) come to such different findings than the German experts. One wonders how far they stray from local opinions in the other countries.
As campaigners, they should carry the “100 percent renewable” banner. (It will be hard to get people to march behind “85 percent renewable.”) But as top scientific researchers, they risk their reputations by putting campaigning ahead of research. We need scientists to stay above the fray and refrain from hyperbole.
In Germany, the question of whether a 100 percent is the right target currently divides proponents of renewables. The Green Party recently questioned whether it should stick to that target by 2030, which the renewable energy sector itself increasingly feels is unrealistic (report in German).
Craig Morris (@PPchef) is the lead author of German Energy Transition. He directs Petite Planète and writes every workday for Renewables International.
The 139 nation report seems to be a preliminary document, and, not surprisingly, has little
information per country. Using the numbers for Germany from table 3:
‘End-Use Energy’ = 258 GW (presumably averaged over year => 2,260 TWh/a )
‘Fraction of End-use E provided by residential PV’ = 5,72%
‘Fraction of End-use E provided by utility PV’ = 51.2%
From table 4, installed residential PV = 100 GW, listed as 90% of max. available.
We conclude that 100 GW installed provides 0.0572*258 = 14,76 GW, so the PV capacity
factor used is 14.76/100 = 15%. No number is given for installed utility PV. Assuming the
same capacity factor (although utility solar should be somewhat more efficient) we get
258 GW * 0.51/ 0.15 = 877 GW installed (!!!!). Including also the commercial solar category,
the total installed solar is 1081 GW. This is to be compared with about 170 GW in the Fraunhofer
85% scenario. What is happening ??
My conclusion, without any special knowledge, is that the Jacobson ‘optimization’ had limits set
for maximum installed wind and rooftop/commercial solar, and that all excess demand was tipped
into the ‘utility PV’ category. The ‘excess’ capacity presumably generates electricity which is being converted to hydrogen for transport and electricity generation and heat in ground fields, both inefficient processes, which is the problem becoming evident in the Fraunhofer 90% scenario. A
further note is that the Jacobson paper assumes no bio-energy contribution, so this must also be made up by solar.
Jacobson’s group is doing some good work, but my impression is that their publicity outruns their results. The ‘100% everything is great’ conclusion appears to apply to the world as a whole, but not necessarily to each piece of it. The detailed result for the USA looks much better – there one is dealing with a much larger grid with a range of climate zones, etc. so that things average out better.
This will undoubtedly be a continuing story.
100% clean and renewable wind, water, and sunlight (WWS) all-sector energy roadmaps for 139 countries of the world (summary paper)(xlsx-spreadsheets)
two more (short) notes:
1. German End-Use Energy TWh/a = 2260 (Jacobson) / 1790 (ISE 85%) => Jacobson is 26% larger (maybe because ISE assumes thorough energy use reduction for buildings)
2. For asking whether Jacobson’s scenario is realistic, the 1080 GW installed PV which it derives must be a good place to start (as noted in previous post this number doesn’t appear explicitly in the report but must be pretty close to this value)
It is a blame for Stanford!
see: http://web.stanford.edu/group/efmh/jacobson/Articles/I/WWS-50-USState-plans.html
in xlsx-spreadsheets, table 2, it is shown that Germany is not able to power itself with water, wind in solar, even in 2050.
Thank you Math. More specifically I see in the .xlsx table 2 for utility PV,
Maximum Technical Potential for Installed Utility PV : 464 MW
Amount Needed from optimization: 904 MW, or 194.8% of assumed maximum
This certainly deserves a comment from the authors. I assume that the costs are for the Needed value. It’s not yet clear to me whether the costs include capital items such as electrolysers, H2 to fuel conversion, H2 storage and turbine generators, etc., and financing thereof. The execution does seem to be still very primitive compared to the Fraunhofer ISE work.
Here another study just around in the news showing how a decentralized 100% RE power supply in Germany could be done:
http://www.acatech.de/flexibilitaetskonzepte-2050
Reported in the ZEIT today:
http://www.zeit.de/wirtschaft/2015-12/energiewende-erfolg
Hi Craig – excellent sum-up there! Wow, I’m amazed at the comments in the global social media sphere on this. So many self-proclaimed “experts”. My 2 cents is that this entire debate is derailed and potentially puts dangerous smoke around openly discussing energy – and here I fully agree with what you say above. This is not about the technical possibility – we are already there. The most important is get people recognize the value in these roadmaps. To start generating the sort of discussion that kicks in motion the more behemoth and slow-moving socio-technical systems: societal and political will. https://theconversation.com/100-renewable-by-2050-the-technology-already-exists-to-make-it-happen-82925