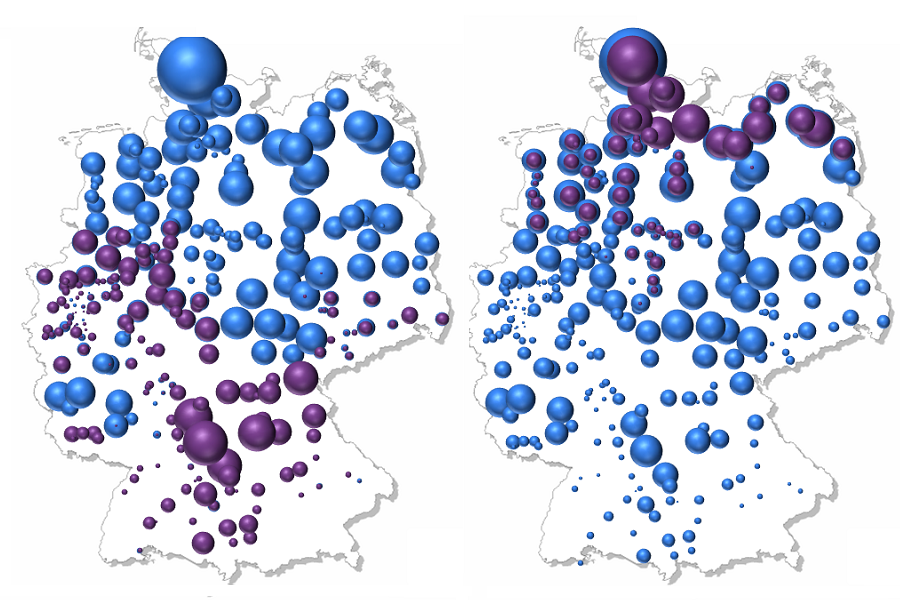
In Agora’s two optimized scenarios, the blue circles represent current installed capacity; the purple, what would need to be added. In the consumption-driven scenario, more is installed across the entire country, whereas the resource-driven scenario has most new installations going up in the north alongside most of the existing ones. (Photo: Agora Energiewende)