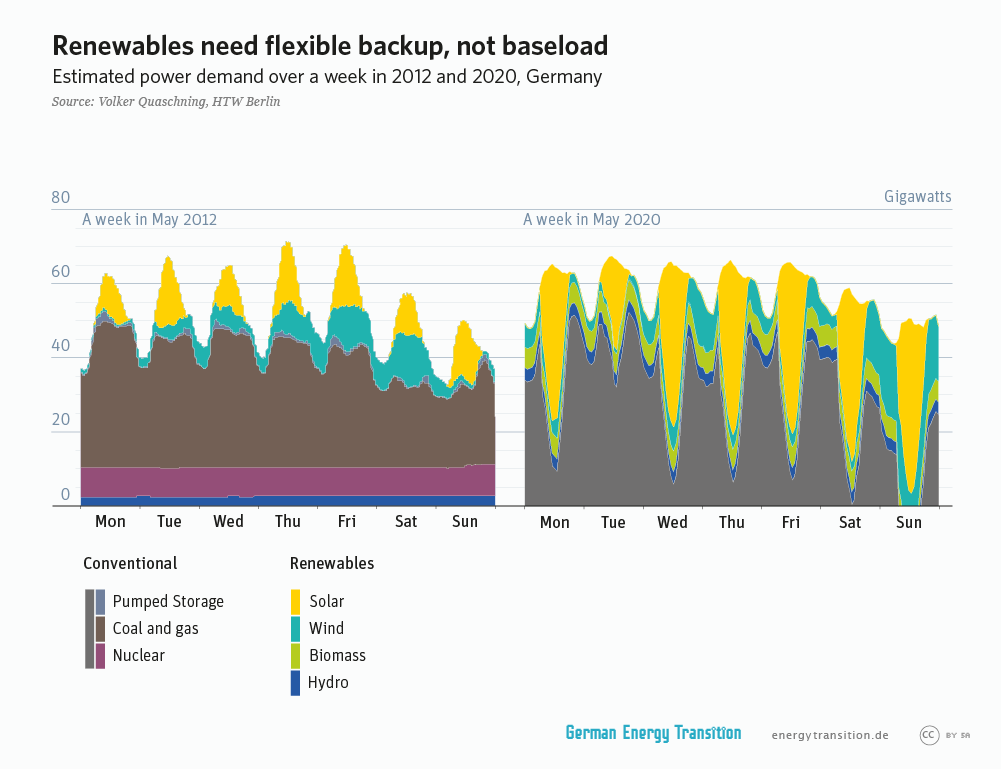
Originally produced in 2010 by Prof. Volker Quaschning, this chart shows that the Germans have long understood that the residual capacity for wind and solar will need to be as flexible as possible.
Originally produced in 2010 by Prof. Volker Quaschning, this chart shows that the Germans have long understood that the residual capacity for wind and solar will need to be as flexible as possible.