The German Network Agency has published an overview of power curtailment in 2014. While the level has reached a new high, it is still in line with what is normal in other countries. Craig Morris takes a look.
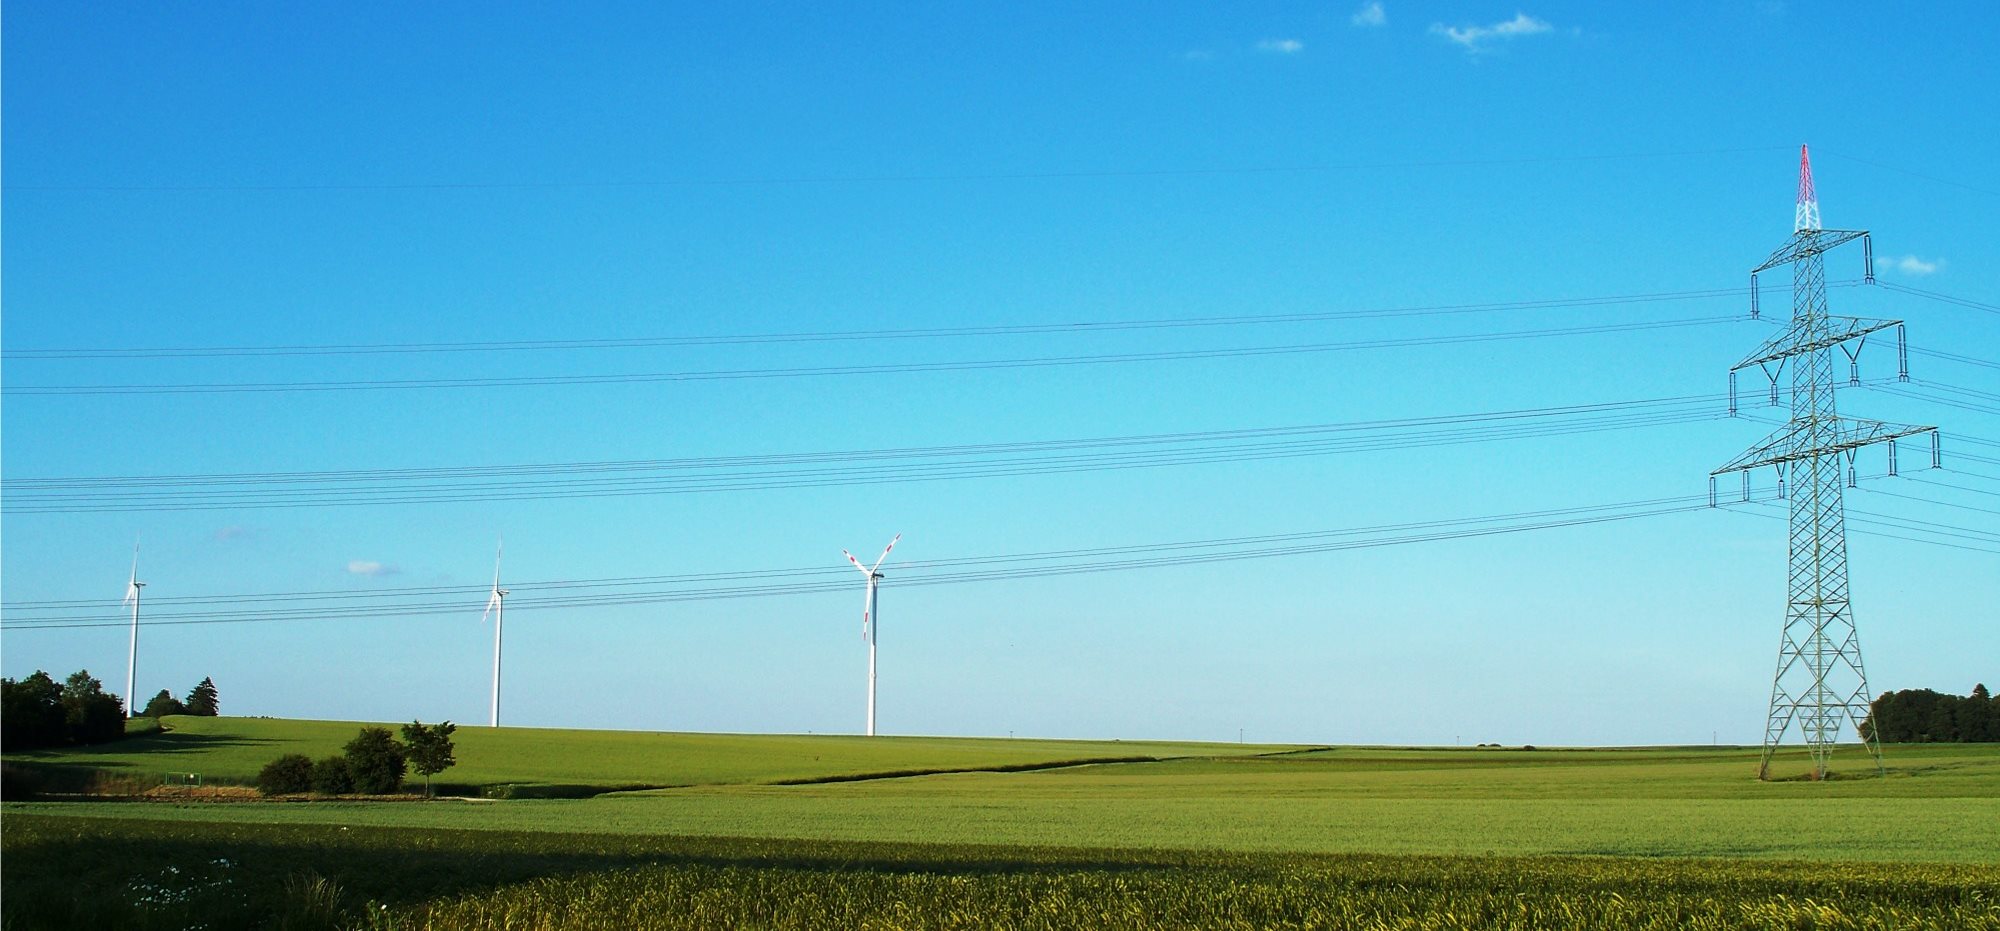
Particularly for wind power, curtailment can become an issue. (Photo by High Contrast, modified, CC BY 3.0 DE)
Germany’s Network Agency has published its overview of the renewable electricity statistics for 2014 (report in German). If you are interested in a state-by-state overview, that’s the place to go. Today, I will focus on one aspect: renewable power curtailment.
As the chart below shows, curtailment skyrocketed in 2014. And as the Agency’s President Jochen Homann put it, “more renewable electricity was curtailed in 2014 than in 2009-2013 collectively” (report in German). In a year-to-year comparison, the amount almost tripled. In total, 1.16 percent of renewable electricity was lost in this way last year, compared to 0.44 percent in 2013, 0.33 percent in 2012, and 0.41 percent in 2011. In 2009 and 2010, the level was 0.10 and 0.15 percent, respectively. The price tag for these power losses comes in at 82.7 million euros.
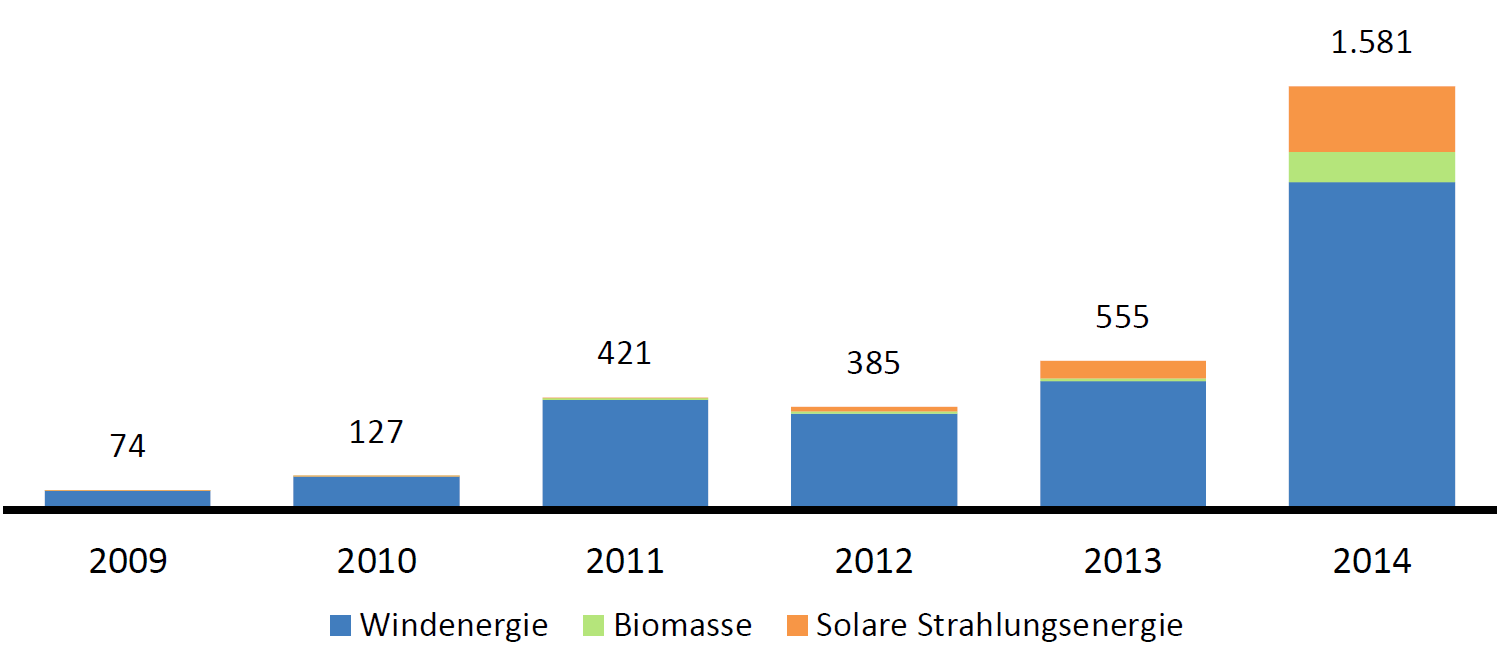
Gigawatt-hours of renewable electricity curtailed by source: wind power (blue), biomass (green), and solar power (orange). Last year was the first year with significant biomass curtailment, but solar power losses nearly quadrupled, while wind power curtailment rose by some 150 percent. Source: German Network Agency
The agency explains that a lot of this curtailment was related to wind power in the north not able to reach the demand centers in the south of the country – further evidence that grid lines need to be built (although another option, regional price signals for power to heat, etc., could also be pursued).
How high are these levels in an international comparison? Actually, it’s not that easy to say for a lack of data from other countries. (If you have any, do drop us a comment below). The chart below is available from the UK’s National Grid Winter Outlook (PDF).
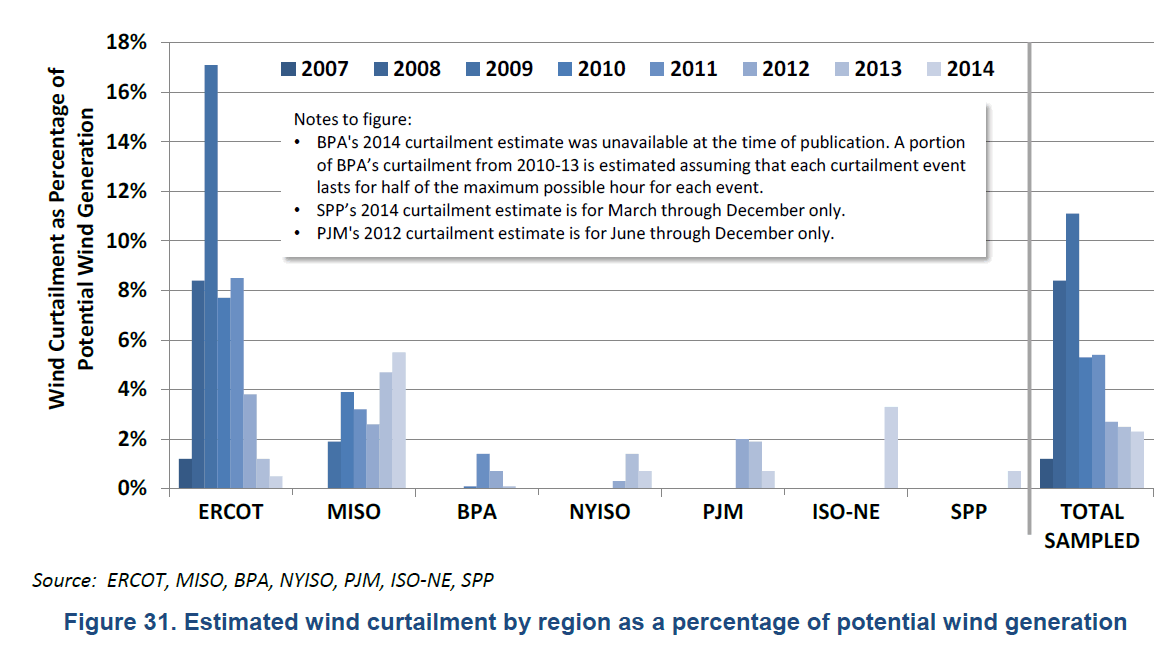
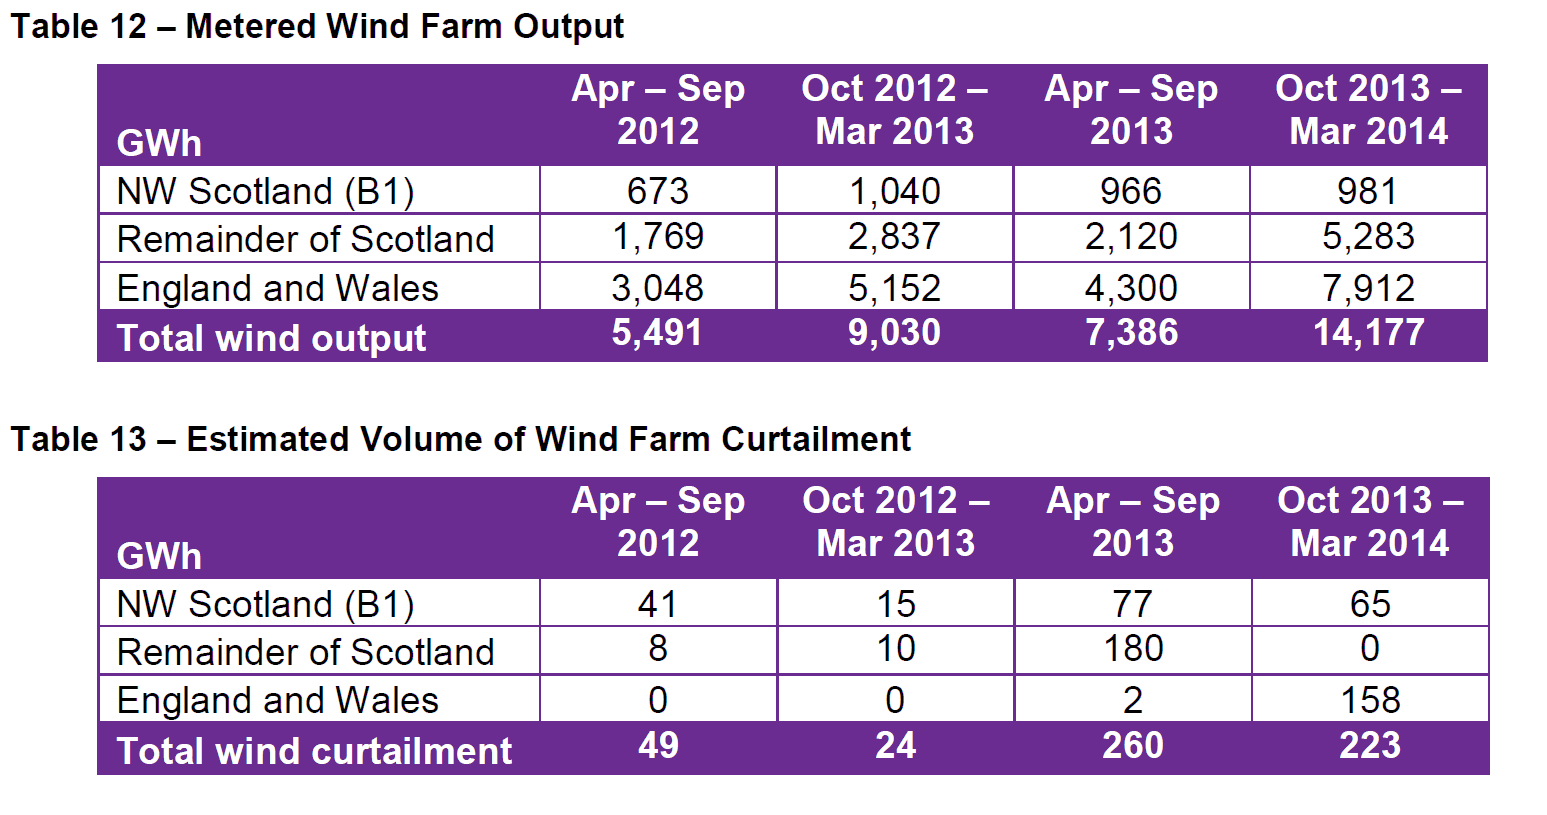 It shows that wind power curtailment alone was at 1.6 percent in fiscal 2013-2014, down from 3.5 percent in the previous year. A comparison, the amount of wind power alone curtailed in Germany was 2.3 percent in 2014. A report from the US in August (PDF) shows the difficulty of comparisons; the US overview provides statistics haphazardly for specific grid regions. For instance, “the degree of wind curtailment has declined recently in what historically have been the most problematic areas. For example, only 0.5% of all wind generation within ERCOT [Texas] was curtailed in 2014, down sharply from the peak of 17% in 2009.” The chart below shows how greatly wind power curtailment differs between seven (out of 12) ISO regions in the US; the study says not all ISOs are able to collect data on wind power curtailment yet.
 In conclusion, curtailment is largely an issue for wind power worldwide; far fewer statistics are taken for solar and biomass – primarily because these two sources are not generally at the level of wind power in most countries. Furthermore, losses do not grow in linear fashion. Rather, there may be a spike one year that a grid upgrade in the subsequent year addresses. Likewise, they tend to be local: in the UK and Germany, the grid is not completely able to transport wind power from the north (Scotland, in the case of the UK) to the south. And finally, the uptick in Germany in 2014 should be addressed in the next few years, if current grid upgrades are completed in time. Until then, this level of curtailment may be sustained or might even increase.
Craig Morris (@PPchef) is the lead author of German Energy Transition. He directs Petite Planète and writes every workday for Renewables International.
It is interesting to watch the grid management working, the Energiewende seems to be no problem.
As Torsten Zoerner points out the actual costs of the grid management are falling:
https://blog.stromhaltig.de/2015/11/monitoring-2015-immer-weniger-regelleistung-notwendig-kosten-fuer-systemdienstleistungen-auf-rekordtief/
€ 82.7 million spend on ‘skyrocketing’ power curtailment of REs are a drop in the ocean when looking at the overall costs, a meager 8 % of the annual management costs.
Which are down by a total of € 340.- million when comparing 2014 with 2009, see Mr. Zoerner’s blog article.
And the grid management is successful, never had the SAID value (black-outs) been better. The grid stability (Hertz) seems to be getting better as well.
Which is due to decentralization and better management methods I’d say.
“a meager 8 % of the annual management costs.” no doubt some anti-RE blog will misrepresent this as 8% of electricity cost.
What are the curtailment numbers in 2015?