The European Commission just gave the go-ahead to a strike price for new nuclear power in the UK – essentially feed-in tariffs. Since it is adjusted for inflation, how can it be estimated over a period of 35 years? Craig Morris investigates.

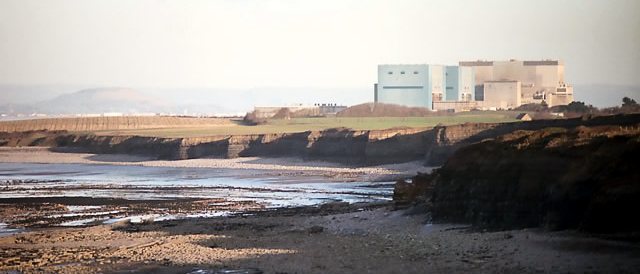
Power from Hinkley Point C won’t cost the taxpayer 109€/MWh, but closer to 150-200€/MWh – which makes it even less competitive with renewables. (Photo by Richard Baker, CC BY-SA 2.0)
Making graphics is tricky. Take this chart of ours, which is not only popular, but also potentially confusing, as one reader pointed out (see the comment from Francis).

As Francis states, the strike price for new nuclear in the UK is around 90 pounds per megawatt-hour, far less than the 155 euros indicated in our chart above as the “low average.” What gives?
Obviously, we first had to convert sterling into euros, and that exchange rate fluctuates all the time. But the biggest uncertainty is the inflation rate. You see, the British government not only aims to offer a guaranteed price for new nuclear power, but also adjust that rate to inflation – meaning that the price will go up over time. (Note that, while some countries such as France also have inflation-adjusted feed-in tariffs for renewables, Germany does not.)
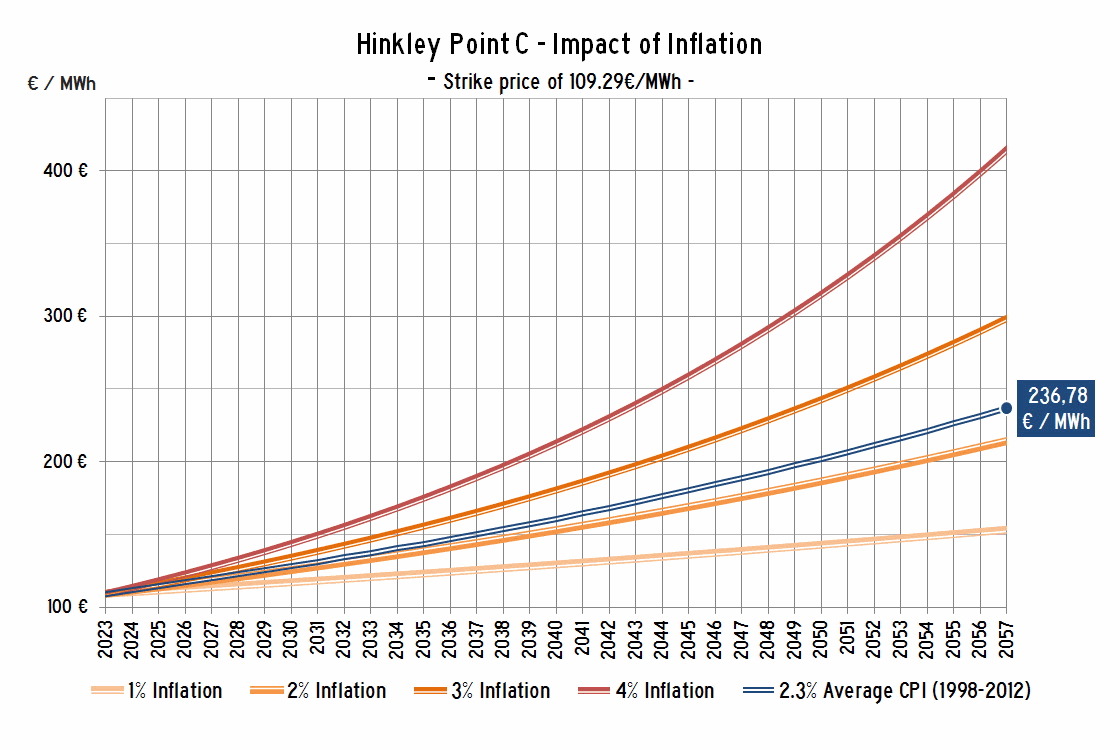
To show what difference this makes, I asked our graphics expert Thomas Gerke to send me the original draft chart we worked on to see how we might represent an average of the prices for power from the new nuclear plant at Hinkley.

Over a term of only 35 years, you see what a tremendous difference the inflation rate makes. Nuclear power from Hinkley might cost only around 150 euros per megawatt-hour in 2057 at an average of one percent inflation per year, or it could be above 400 euros at an average inflation rate of four percent annually. Note that the UK has not had one percent inflation sustainably in recent history. A level between two and three percent seems more likely.
But even once you know that, you have to average whatever line you choose from the draft graphic above in order to state a single range as we do in the chart eventually used. Taking the blue line in the middle as an example, you have to calculate a weighted average from around 115 euros today to around 240 euros by 2057. And of course, if the inflation rate skyrockets at any point during those 35 years, all bets are off anyway.
In contrast, the figures we give for renewables in the chart at the top are actually quite conservative. Partly because German feed-in tariffs are not adjusted for inflation, we know the prices will go down.
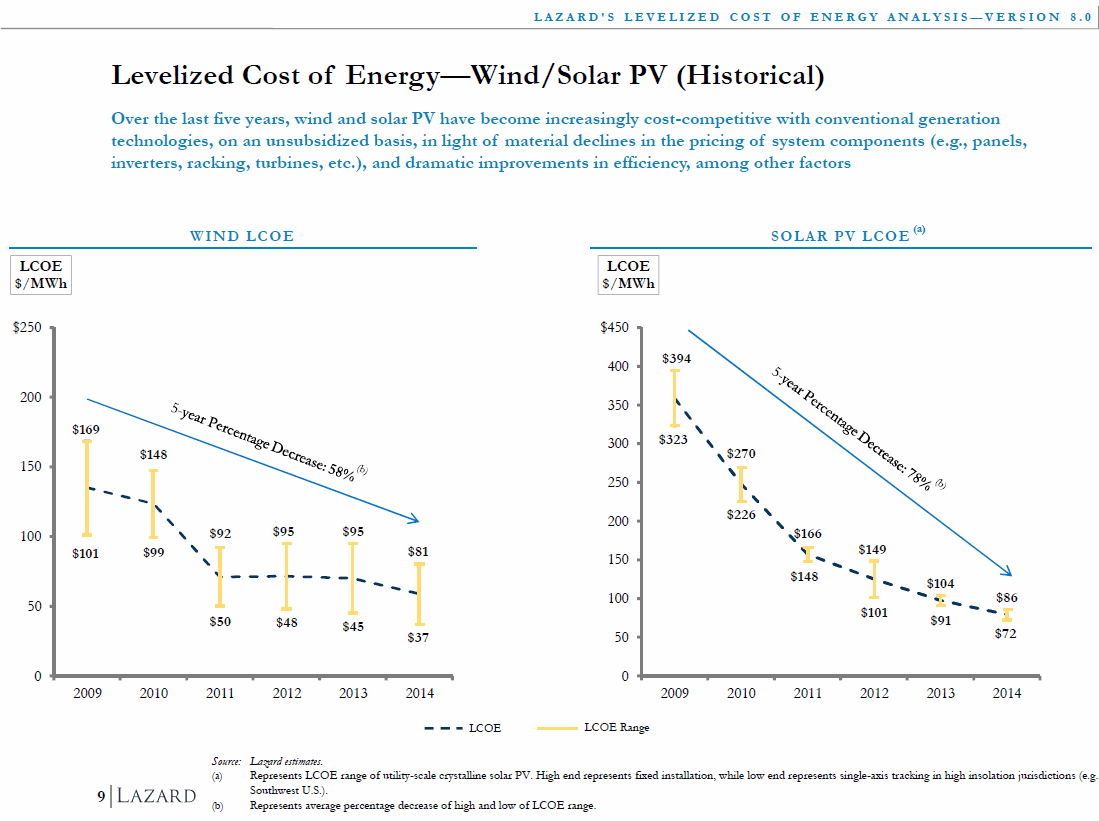
Naturally, the technologies themselves will also have to become cheaper, but all signs indicate that the future looks bright for wind and solar power. The International Renewable Energy Agency (IRENA) sees the cost of PV continuing to drop by the end of this decade, and market researchers at Lazard also track the falling levelized cost of both solar and wind in a study published in September (PDF).

Source: Lazard
In short, we feel that our chart comparing the strike price for new nuclear in the UK and feed-in tariffs for wind and solar makes a fair assessment of how the price of nuclear may develop and makes a conservative estimate of the price of solar and wind going forwards. We actually expect far lower prices from wind turbines and solar panels.
What do you think? Is the final version of our chart more helpful than the draft? Or would you present the data some other way? As we approach the winter, we will start thinking about what needs to be done for the annual update of this website, so drop us a comment below if you have an opinion.
Craig Morris (@PPchef) is the lead author of German Energy Transition. He directs Petite Planète and writes every workday for Renewables International.
In the end I doubt it will matter. The opposition is going to mount an all hands on deck campaign against this plant. From a financial point of view the plant looks dead before it’s even started.
“The new Hinkley Point C nuclear power station will require debt financing of GBP 17 billion (around €21.6 billion) and will eventually have a capital of about GBP 34 billion (around €43 billion).”
http://europa.eu/rapid/press-release_IP-14-1093_en.htm
Yes, your graphs are misleading as you don’t compare strike price of UK wind and UK solar to UK nuclear. If you did you’d notice that UK pays much, much more for their 0-CO2 energy than Germans do. And THAT is the real story.
Eka, the UK pays more for electricity from corporations, who demand higher profits. That is the real story. Wind power in Germany is cheaper because people build it themselves.
As Esa Vakkilainen mentions, the comparison is completely bogus as it is comparing two different mechanisms.
The UK strike prices offered for offshore wind and solar are all higher than those for Hinkley Point C. Those offered to wave and tidal are three times higher. The strike price for onshore wind is about the same.