“The duck has landed,” writes California-based energy expert Meredith Fowlie about renewables pushing demand for conventional power at midday below the overnight level. But what Californians call a technical limit is, in reality, a political one, as Craig Morris’s comparison with Germany reveals.
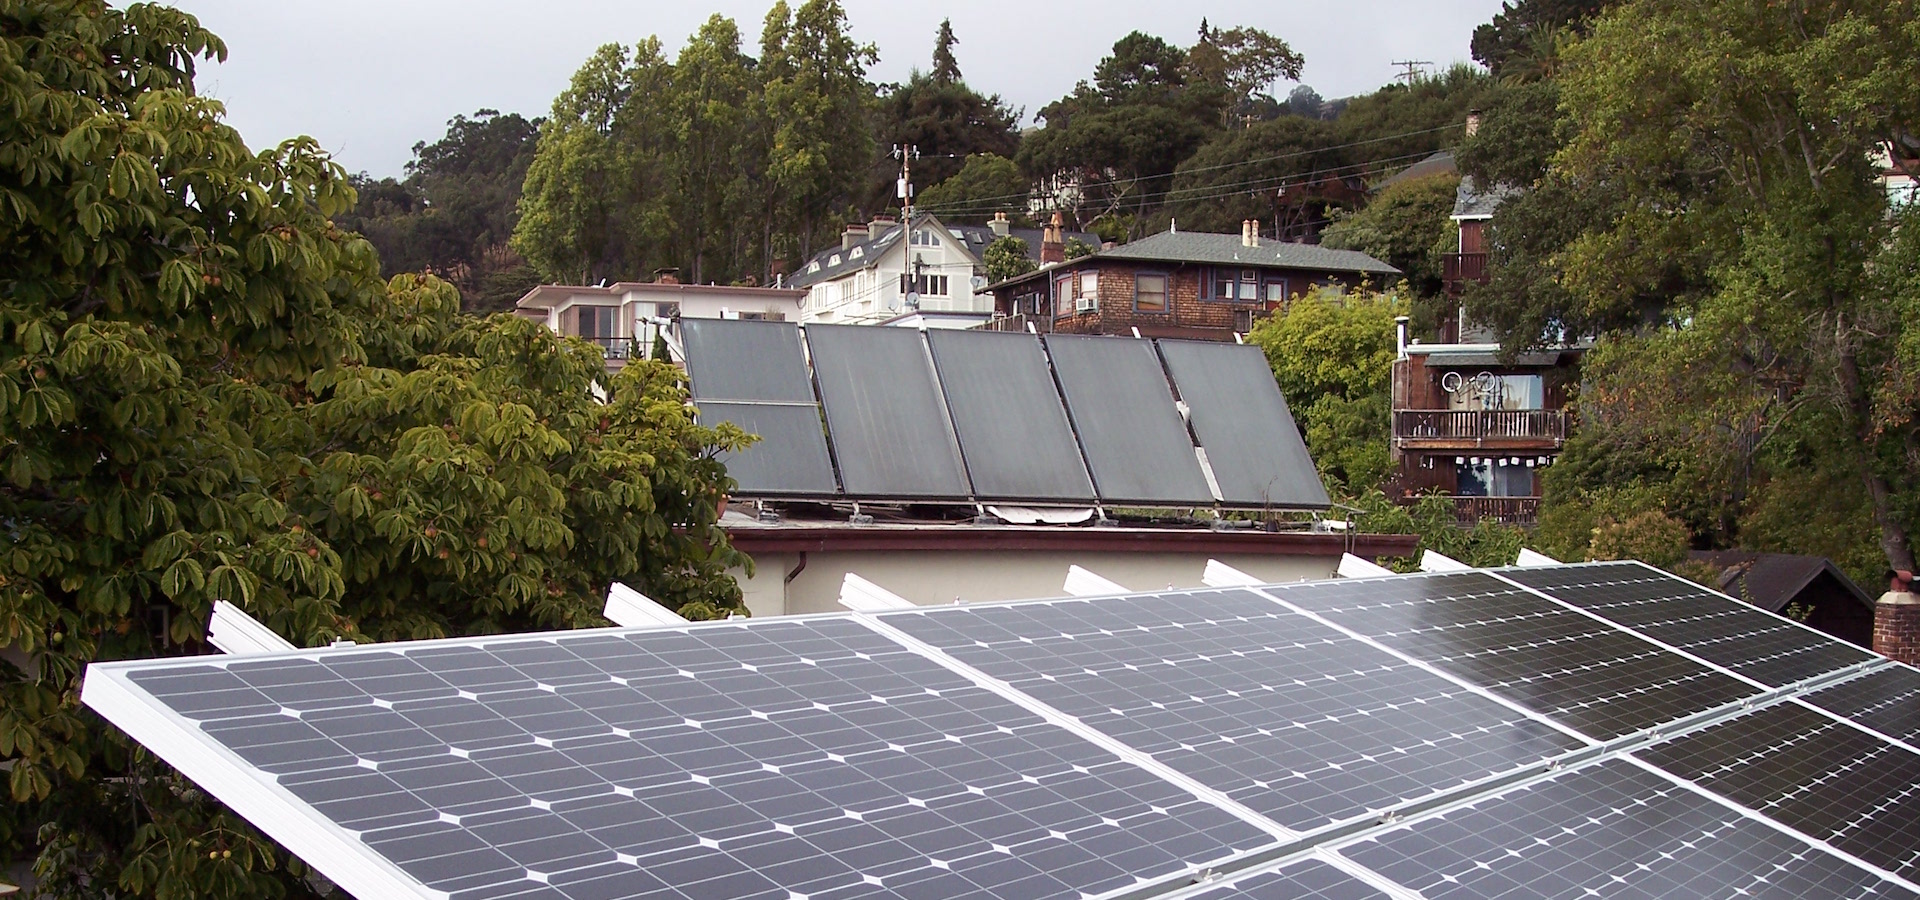
Solar water heating panels and solar photovoltaic panels in Berkeley, California. (Photo by Alfred Twu, edited, CC0 1.0)
Recently, I wrote about how California and Germany see the world differently when it comes to renewables. Simply put, Californians believe they have “excess” renewable electricity at a point where the Germans would say California hasn’t broken a sweat yet.
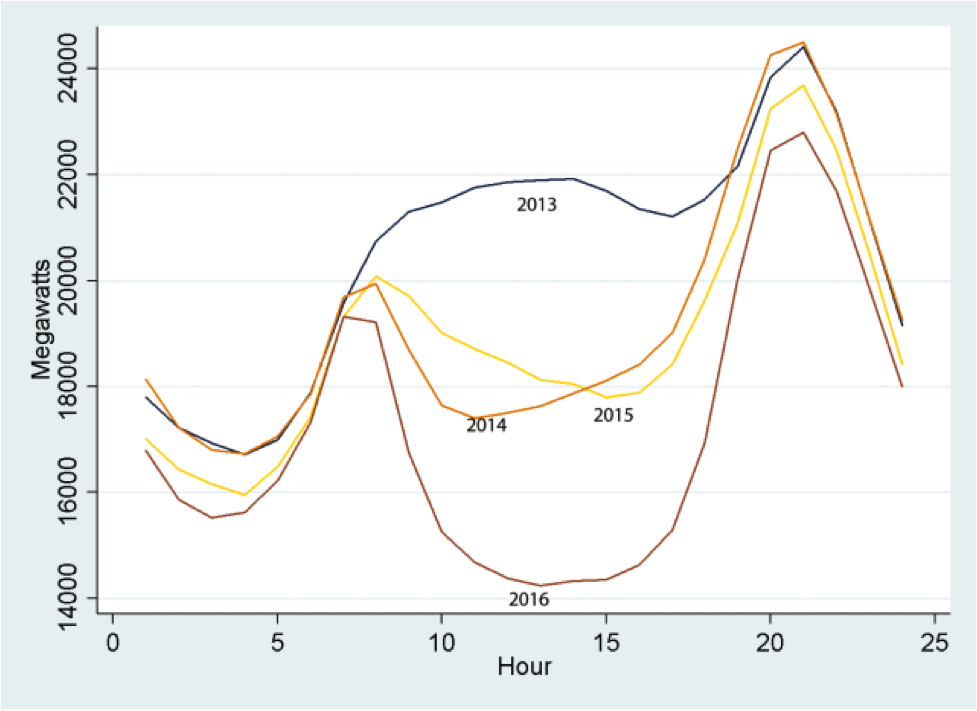
“Duck landing” chart created by Meredith Fowlie, using data from CAISO
Here we see what the Germans call the “residual load” and what Fowlie’s blog post at UC Berkeley’s Energy Institute calls the “net load” – peak demand for non-renewable electricity. In 2013, the level was around 22,000 MW at noon, but solar power production at midday is reducing that level to 14,000. Fowlie concludes that “renewables integration challenges (sic) are showing up more or less on schedule.” She says that “the duck’s growing belly highlights the near-term potential for ‘over-generation.’” She adds that “California is not alone in creating and confronting unprecedented renewable integration complications” but otherwise only refers to Hawaii. Wow, sounds like California is entering new territory with renewables!
It isn’t. The first thing a German would do is set the baseline to zero, thereby putting the duck in a very deep lake.
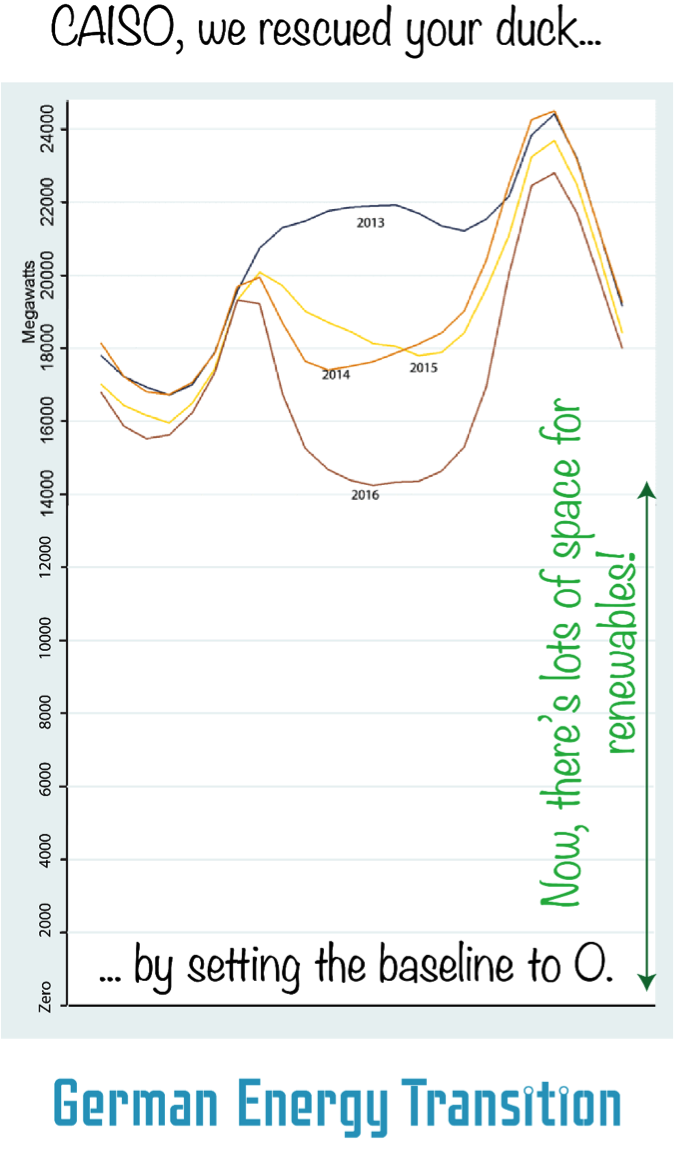
Second, a German would conclude that there is a lot of space left for renewables. You see, the residual/net load is only pushed down by a third (from just below 22 GW to just above 14 GW). Germany regularly has days where renewables peak at more than half of midday demand. Here is the entire month of May, for instance:
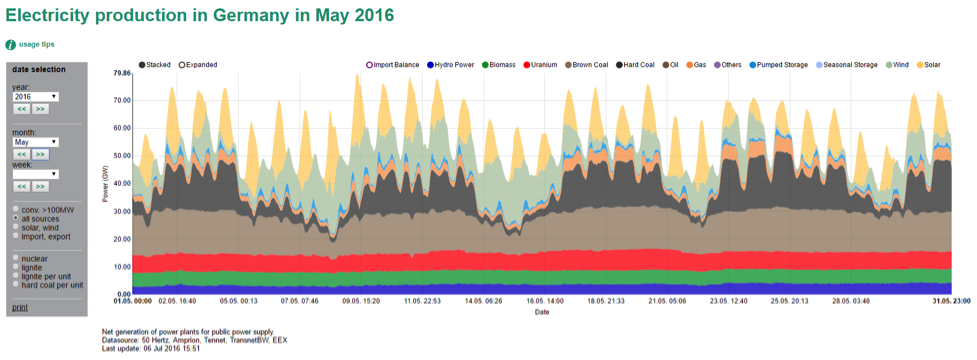
Source: Energy-Charts.de
So once again, there is plenty of space for renewables to grow in California. The barrier is financial, and hence political – but not technical. Fowlie speaks of renewables “bumping up against the minimum generation levels” of conventional power plants, otherwise known as the must-run level. But in technical terms, the must-run level of California’s fleet is far, far below 14 GW. The German power fleet serves peak demand of 80 GW with a must-run level of 20 GW, a quarter as high. And Germany’s fleet is less flexible than California’s, which contains far less nuclear and coal and more hydropower and gas turbines. As a ballpark figure, California’s must-run level must be closer to 6 GW at most. Like so many Californians, Fowlie draws a much higher line at a fictitious financial/political threshold of pain – and then, knowingly or not, mislabels it a technical limit.
Germany has decided to go beyond the fictitious “financial must-run level” by granting renewables priority dispatch, meaning that green electricity cuts into fossil and nuclear power even if conventional facilities have to ramp down. These conventional plants are hurt financially, especially when they are inflexible. It is hoped that the flexible ones will eventually benefit the most from this market setup (though admittedly, that outcome remains to be seen).
To be fair, Californians are also worried about the ability to meet the absolute peak demand in the evening, but the state’s power demand profile does not differ from Germany’s in that respect. Already, the state’s conventional fleet has to go from 14 to 24 GW in just five hours. Admittedly, the extent of that ramping is greater than what Germany had to manage on the day of the eclipse last year. On the other hand, look at January and you see that the German conventional fleet ramped by around 20 GW on most days that month, equivalent to one third of the total generation peak.
If Californians were used to comparing data visualizations, it would be harder to sell the idea of “excess renewables” this decade. In her blog post, Fowlie speaks of the “great data” that CAISO, the grid operator in the region, makes publicly available. She then also admits that she had to create the chart herself – CAISO does not provide any such visualization (nor, frankly, can I see how to access the data to make the chart from the website she refers to). As a visual, CAISO provides you with a PDF for the previous day – and that’s it! I could see no way of sorting through various days and weeks the way you can do (in English and the local language) for the French and German power markets. If you want California 2015 visualized as a whole, you have to get it from a retired French expert.
This lack of transparency in the US matters. Americans would not believe they have “excess” renewable electricity if they could play around with visualized power data like the Germans can. Visualizing Cali’s power sector… sounds like a good task for students at UC Berkeley!
Craig Morris (@PPchef) is the lead author of German Energy Transition. He directs Petite Planète and writes every workday for Renewables International.
Craig, the daily renewables output data is available, but not exactly convenient, at
http://www.caiso.com/green/renewableswatch.html
I expect this is where Meredith Fowlie got the data for her charts.
CAISO’s data is vastly superior to any public German data I’ve ever seen. It could definitely be packaged better but it’s not terribly hard to download the data and package it yourself.
The Fraunhofer reports use great data but it’s not public.
[…] when the bottom axis reflects a minimum of 14,000 megawatts. One German observer notes that this issue (as opposed to the ramp) is exaggerated. For context, the chart is also shown with a zero […]
[…] when the bottom axis reflects a minimum of 14,000 megawatts. One German observer notes that this issue (as opposed to the ramp) is exaggerated. For context, the chart is also shown with a zero […]
[…] when the bottom axis reflects a minimum of 14,000 megawatts. One German observer notes that this issue (as opposed to the ramp) is exaggerated. For context, the chart is also shown with a zero […]
[…] when the bottom axis reflects a minimum of 14,000 megawatts. One German observer notes that this issue (as opposed to the ramp) is exaggerated. For context, the chart is also shown with a zero […]
[…] when the bottom axis reflects a minimum of 14,000 megawatts. One German observer notes that this issue (as opposed to the ramp) is exaggerated. For context, the chart is also shown with a zero […]
[…] when the bottom axis reflects a minimum of 14,000 megawatts. One German observer notes that this issue (as opposed to the ramp) is exaggerated. For context, the chart is also shown with a zero […]
[…] recent post by climate change skeptic Euan Mearns on the infamous duck curve illustrates the problem well. Mearns estimates that a 10% solar share of annual supply would peak […]