The price of solar has plummeted in recent years, but as the share of solar on the grid increases, associated costs will be incurred: idling backup capacity, forecasting errors, etc. Now, leading US researchers have tried to put a price tag on those costs. Craig Morris says the situation they describe for 2027 looks a bit like Germany today.
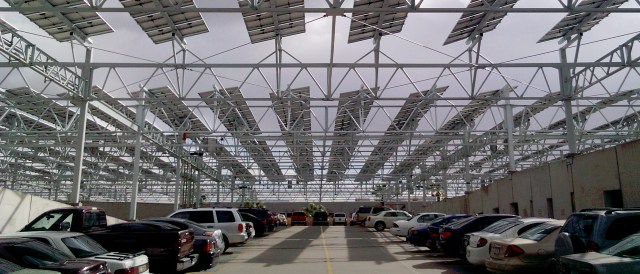
PV installation above a parking lot of Arizona State University. PV is even more efficient in Arizona than in Germany, as solar irradiation is more than twice as high and solar power production is more aligned with daily power demand cycles. (Photo by Kevin Dooley, CC BY 2.0)
Entitled “Integrating solar PV in utility system operations,” the study by US researchers is 144 pages long. I can only sum up their findings here and comment on a few aspects from a German perspective.
The study focuses on the cost of forecasting errors and balancing reserves. As the authors themselves put it, “we recognize that there is no single accepted definition of the term ‘integration costs’ and no agreed-upon way to correctly calculate such costs.” Furthermore, the study is based on scenarios drawn up by Arizona’s utility for 2027, in which an 8.8 percent share of PV on the grid was considered “low” and 17 percent “high.” Note that the scenarios always include 4.9 percent wind power, which is variable and therefore also entails costs for balancing reserves and forecast errors. The authors did not calculate these assumptions themselves, but simply took them from the utility.
The researchers find that the “low PV scenario” for 2027 would lead to an extra 0.18 cents (in USD) per kilowatt-hour under basic assumptions. With other sensitivities taken into account, the range widens to 0.01-0.44 cents, with PV making up 17 percent of power supply by the time that highest figure is reached.
An 8.8 percent share of PV along with 4.9 percent wind power for Arizona in 2027 is strikingly similar to the situation in Germany now, with wind and solar reversed. Last year, Germany got roughly eight percent of its electricity from wind and five percent from solar; in the first half of 2014, wind grew to 10 percent and solar to seven percent.
A comparison with Germany
The impact of solar on the grid is directly related to peak power demand in the summer. In Germany, the profitability of dispatchable capacity has already been significantly and detrimentally affected. But while German power demand peaks in the winter, it peaks in the summer in the US – so the same effects might be felt in the US at closer to 10 percent PV.
If we take a look at the forecast load for 2027 on the Arizona grid investigated (see chart below), we see that the summer load is more than twice as great as the winter load; in a rough estimate, winter peaks in Germany are roughly 10-20 percent greater than normal summer peaks. (From a German perspective, it is strange to see a study done in 2014 based on data from 2005.)
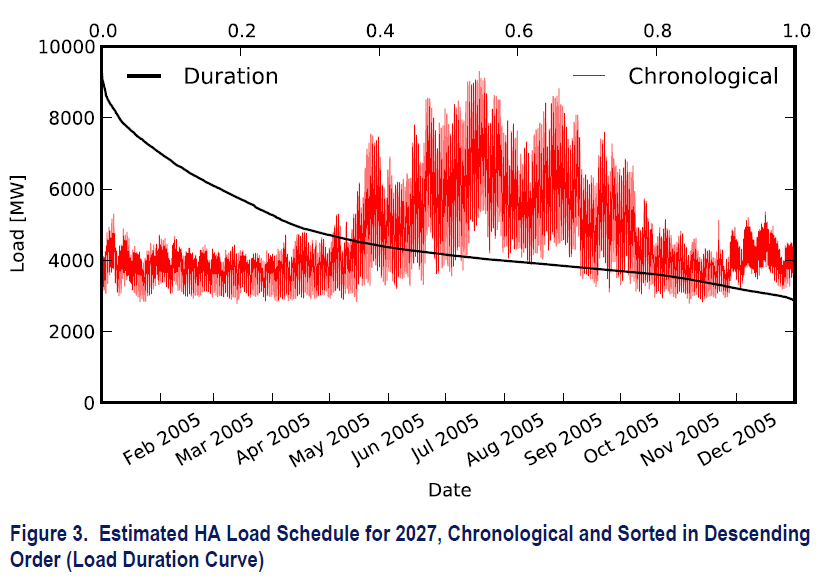
Now consider that the PV peaks in the “high scenario” (!) for Arizona are only a third of peak summer demand (see chart below), a level already quite regularly reached in the summer in Germany, where the absolute peak for PV was 43 percent.
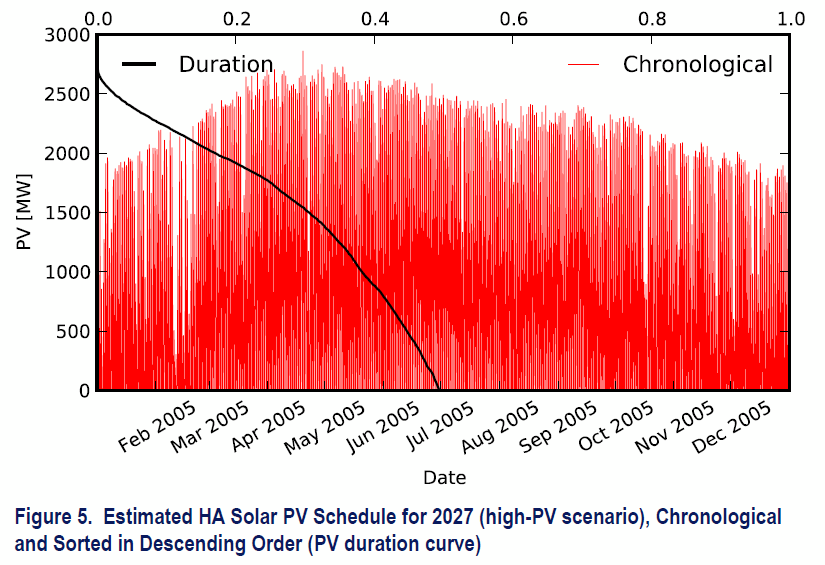
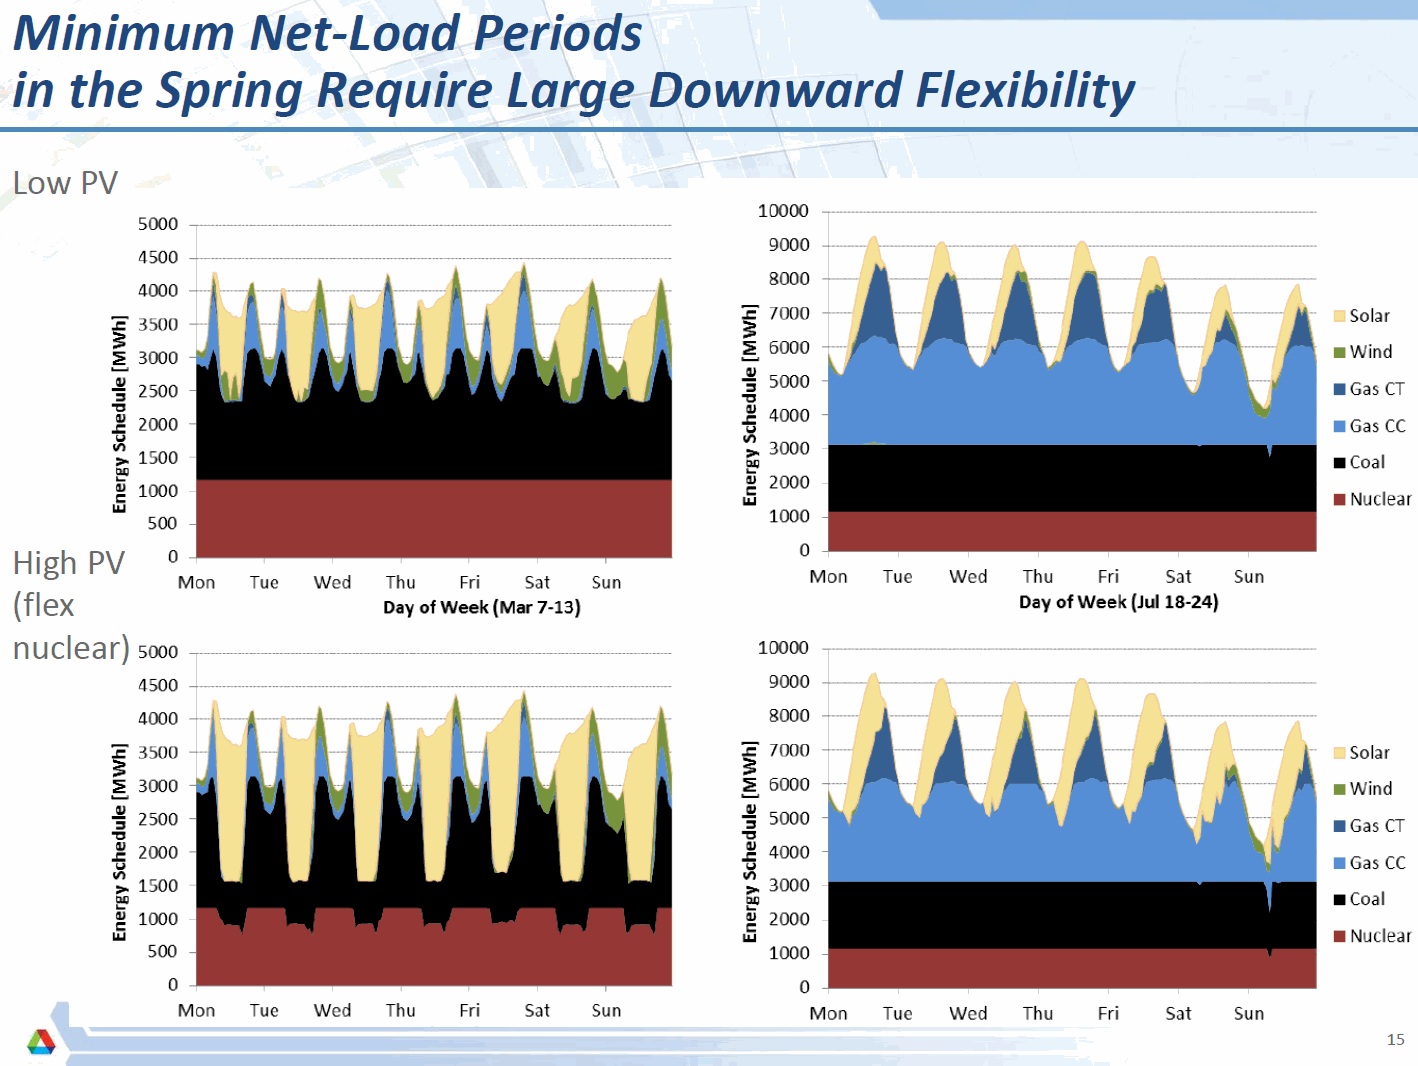
As the charts below show, the impact of wind + solar on conventional plants is similar now in Germany to the forecast for Arizona in 2027.
The chart above shows a number of weekly power curves in various scenarios, and I assume that the “MWh” in the legend is a typo and is supposed to be “MW.” Now take a look at a recent week in Germany (from the wonderful new collection of energy charts provided by Fraunhofer ISE).
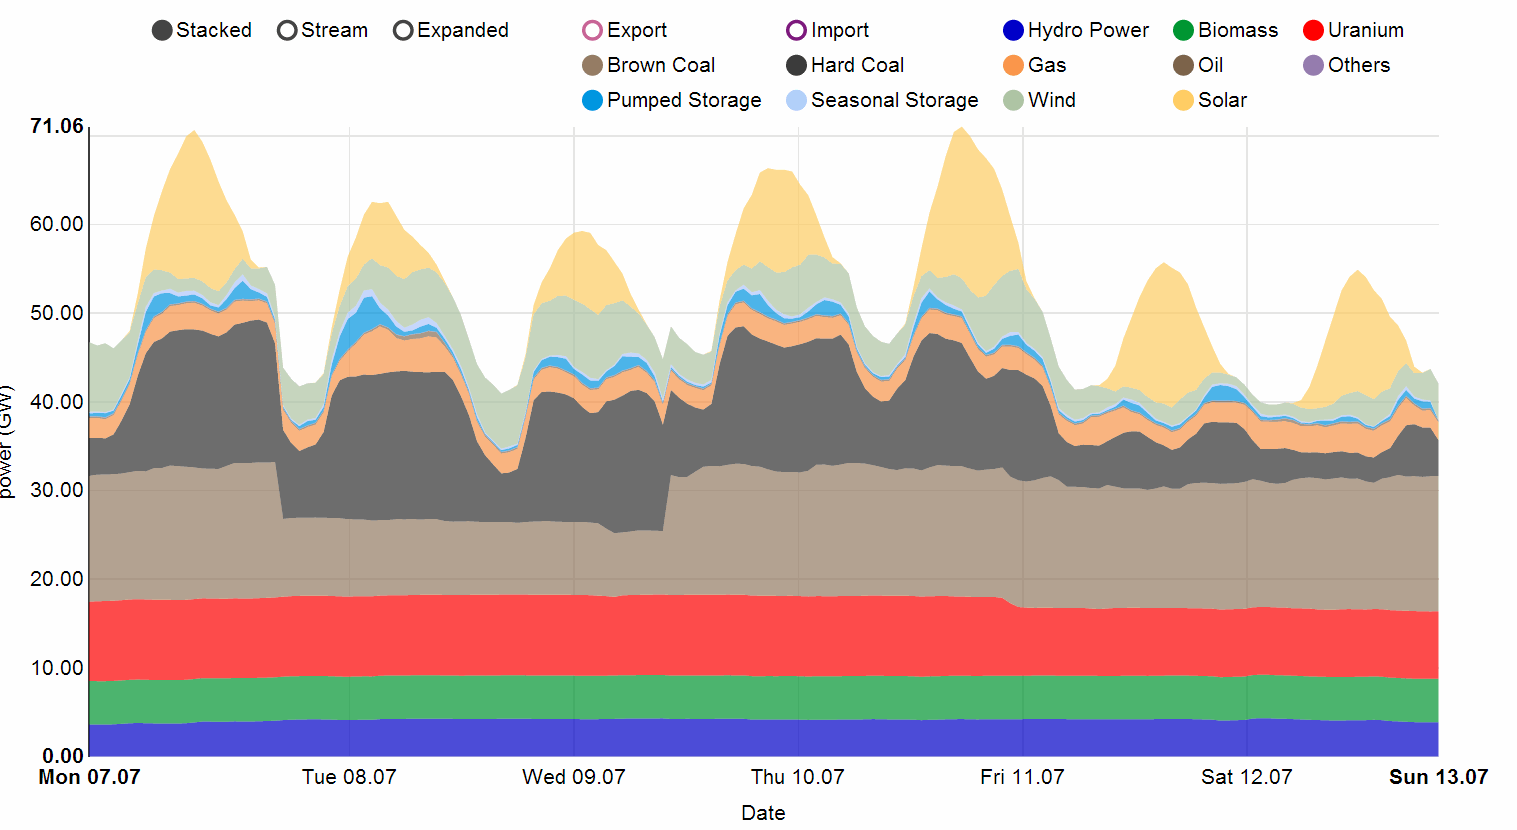
It looks like the German summer is already pretty close to the high-PV scenario for the 2027 winter in Arizona. Now, take a look at the entire month of February (below). We see that the impact of solar and wind combined is noticeable not only on hard coal (which is almost entirely wiped out repeatedly), but also on lignite and nuclear, each of which are forced to ramp down.
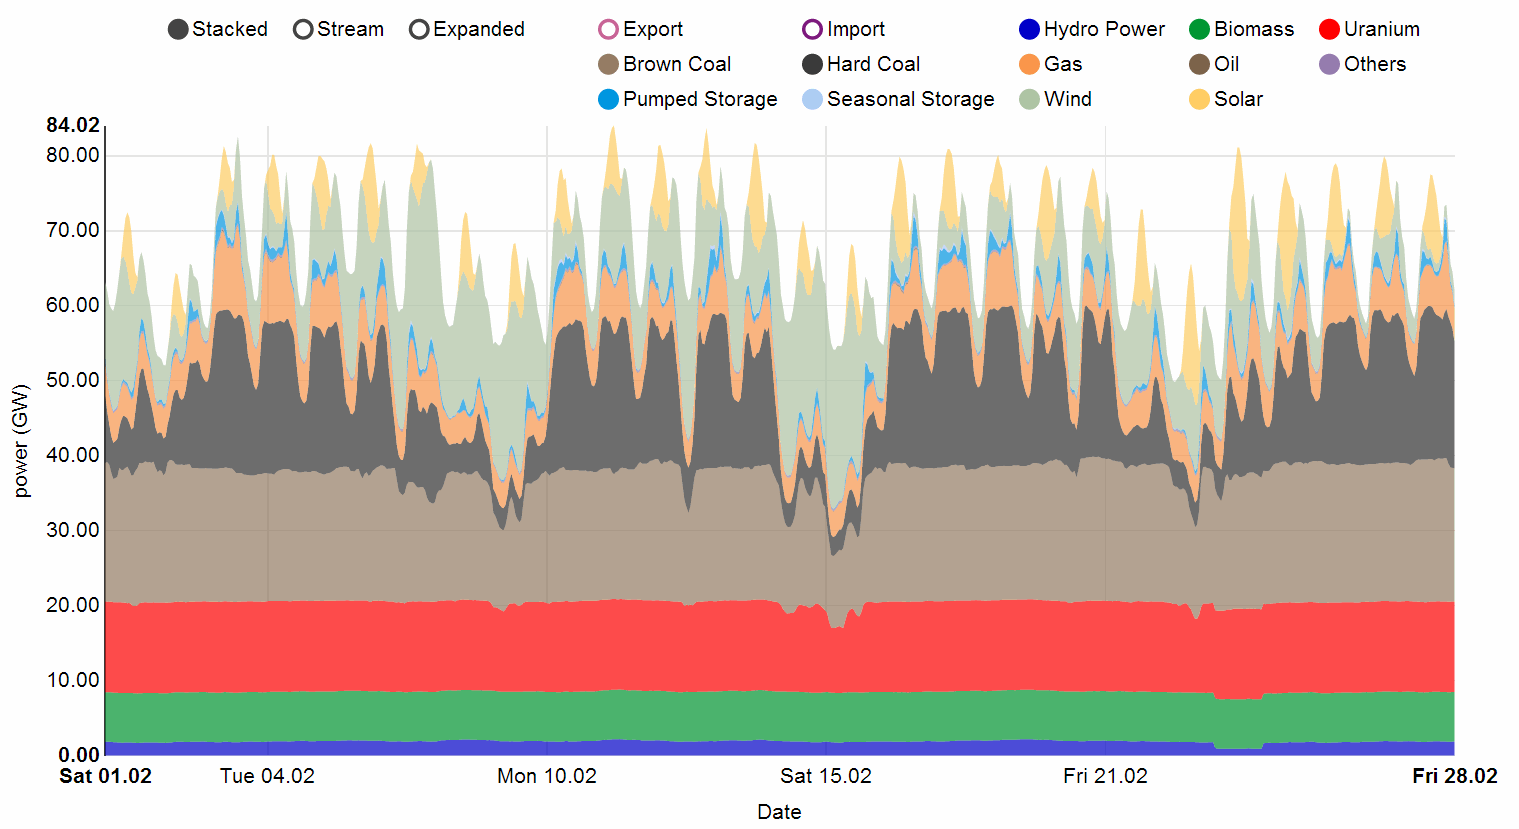
Does Germany face the integration costs described in the US study? Probably. Wholesale power prices continue to fall, but demand for balancing power is growing. And as Bloomberg reported in July, profits from power sales are drying up, but the market for balancing power is increasingly lucrative.
Overall, the German situation reinforces the US study’s findings in general, though I would add two conclusions: first, Germany shows that Arizona can go much further with solar than in either scenario investigated; and second, utilities need to focus less on power sales and more on providing services – including reliability – to remain profitable.
Craig Morris (@PPchef) is the lead author of German Energy Transition. He directs Petite Planète and writes every workday for Renewables International.
It would be fair to add integration costs of large scale fossil and nuclear plants. It costs a fortune to backup a plant which may completely fail any moment (one broken pump and 1 GW is gone – Temelin few days ago) by spinning reserve.
Overall integration costs of solar in a country far from the equator, like Germany, have to be expected to be far more than in Arizone, because of the severe seasonal mismatch.